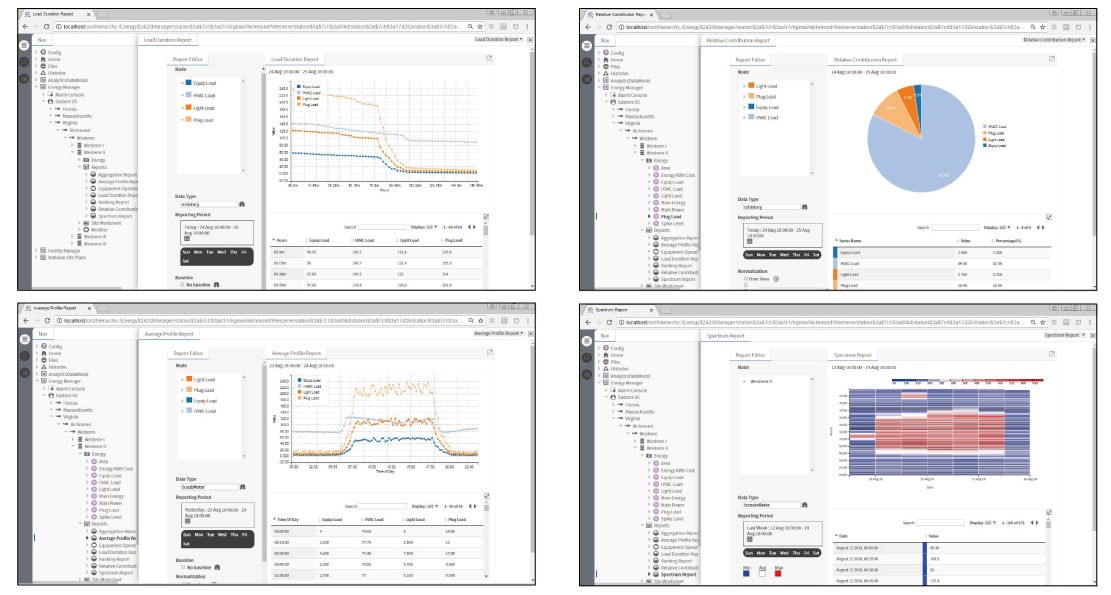
Discover Equipment Anomalies Early Through Data Analytics
Niagara Analytics is an analytics solution that analyzes data collected from building systems in real time to enable anomaly detection, energy optimization, and improved facility operations. By visualizing analytical insights, it helps organizations make faster, more informed decisions and improve operational efficiency.
Key Features of Niagara Analytics
Early Detection of Equipment Anomalies
Analyze operational data from building systems in real time to identify early signs of anomalies and performance degradation. This helps prevent equipment failures, minimize unplanned downtime, and reduce operational risks.
Optimized Facility Operations
Visualize equipment performance and operational conditions through advanced analytics. By turning data insights into actionable improvements, organizations can reduce energy consumption, enhance operational performance, and optimize overall facility efficiency.
Real-Time Analytics
Perform real-time data analysis directly on JACE and Niagara Edge devices. By providing immediate visibility into operational conditions, Niagara Analytics enables faster decision-making and more effective facility management.
Flexible Analytics Rule Creation
Leverage pre-built analytics libraries to create customized analytics rules and workflows tailored to specific facility requirements and operational objectives. This flexibility enables organizations to address a wide range of use cases and optimize system performance.
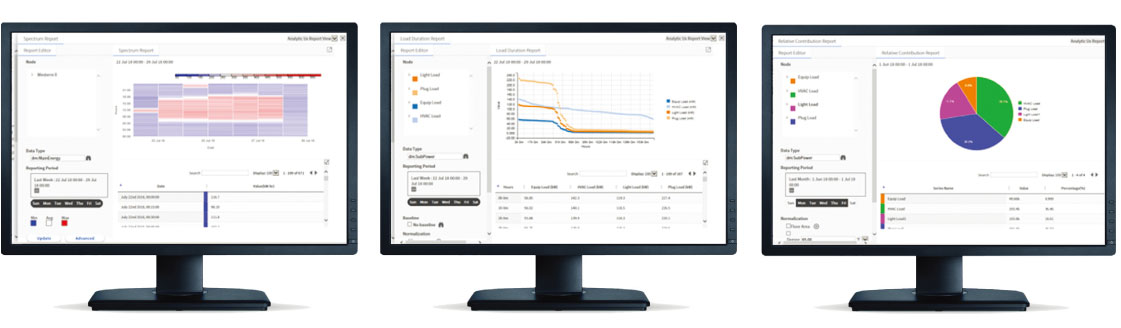
Dashboard Visualization
Visualize analytics results through intuitive dashboards and graphical charts. By presenting complex data in an easy-to-understand format, Niagara Analytics helps operators quickly assess equipment performance, identify trends, and measure the impact of operational improvements.
Open System Integration
Leverage open APIs to seamlessly integrate Niagara Analytics with external applications and third-party systems. This enables greater interoperability, enhanced data sharing, and the flexibility to support a wide range of business and operational requirements.
Key Functions
- Comprehensive Analytics Libraries for Equipment and Energy Analysis
- Reporting and Charting Tools for Energy Performance Visualization
- Efficient Data Management with Haystack-Compatible Tag Libraries
- Alert Functions for Early Detection of Equipment Anomalies
- Improved Analytics Accuracy Through Missing Data Compensation
- Flexible Visualization with HTML5-Based Dashboards
- External System Integration via Open APIs